Popular Indices
, 4 hours
 long
long
#Technical
#Bullish
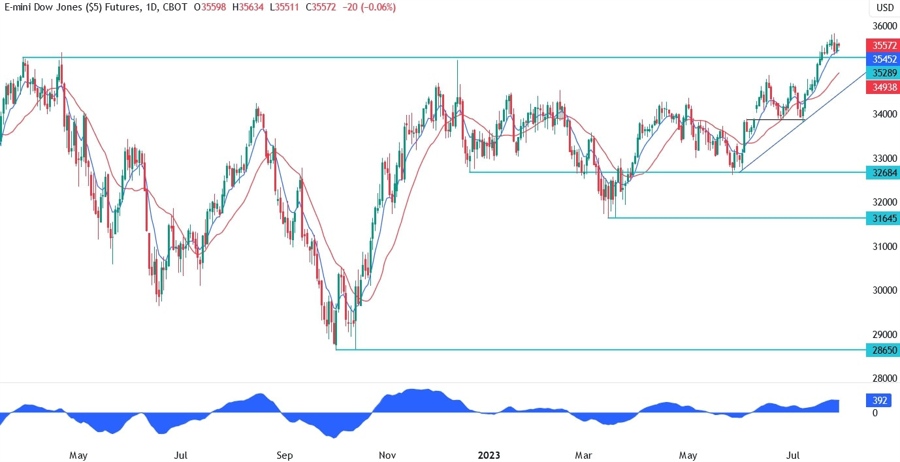
On the 4 hour chart, we can see that we had a divergencewith the MACD which is generally a sign of weakening momentum often followed by pullbacks or reversals. In this case, we got a pullback into the previous resistance now turned support where we had also the 38.2% Fibonacci retracement level for confluence. The buyers stepped in with a defined risk below the support to target the all-time high.
Leave a Reply
You must be logged in to post a comment.