Indices
, 1 hour
 long
long
#Technical
#Reversal
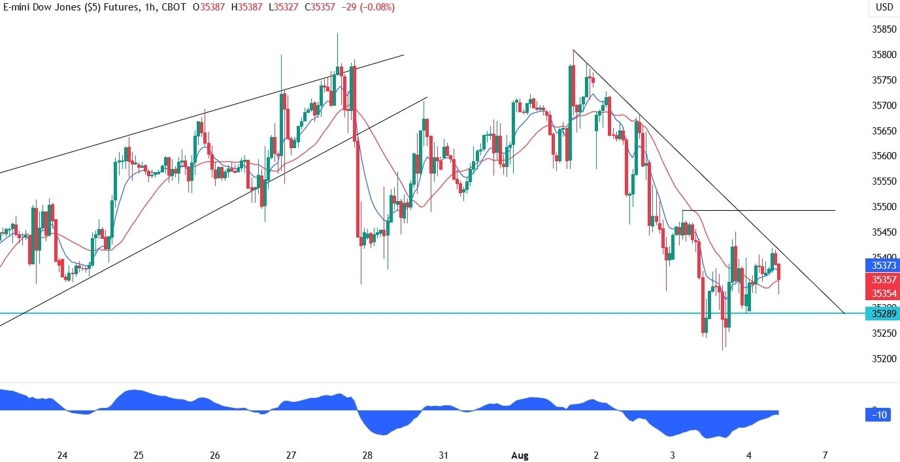
| Resistance 1 | 35500 |
|---|---|
| Quote Price | 35350 |
| Support 1 | 35289 |
On the 1 hour chart, we can see that we have downward trendline defining the current short-term downtrend. If the price breaks above it and takes out the last lower high at 35498, the buyers will have the confirmation of the bounce and are likely to pile in more aggressively to target the all-time high. Aggressive sellers, on the other hand, are likely to lean on this trendline to position for a break lower.
Leave a Reply
You must be logged in to post a comment.