Trading Instruments
, 4 hours
 short
short
#Technical
#Reversal
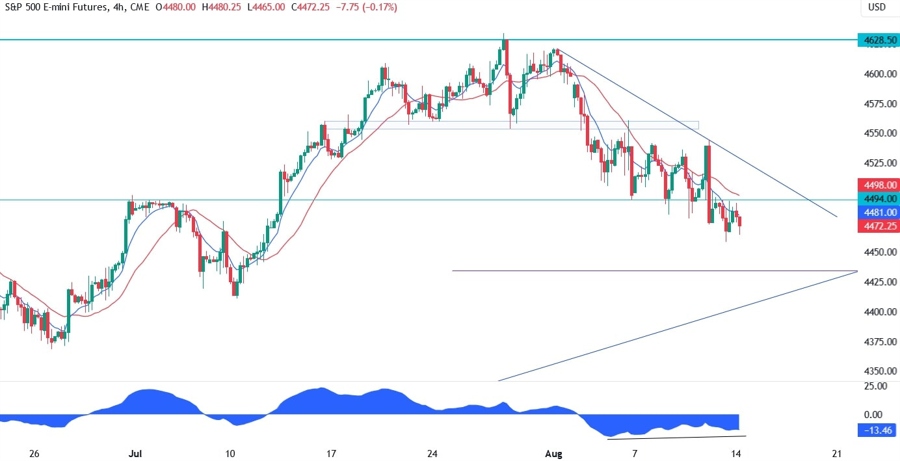
| Resistance 1 | 4550 |
|---|---|
| Quote Price | 4472 |
| Support 1 | 4430 |
On the 4 hour chart, we can see that the S&P 500 broke below a key support zone, retested it and continued lower. The price action though has been choppy, and the bearish momentum has been weakening as we can see from the divergence with the MACD. We are also getting closer to the trendline, so this might be a sign that the market may turn around soon, especially if we get a positive catalyst.
Leave a Reply
You must be logged in to post a comment.