Indices
, 1 day
 long
long
#Technical
#Bullish
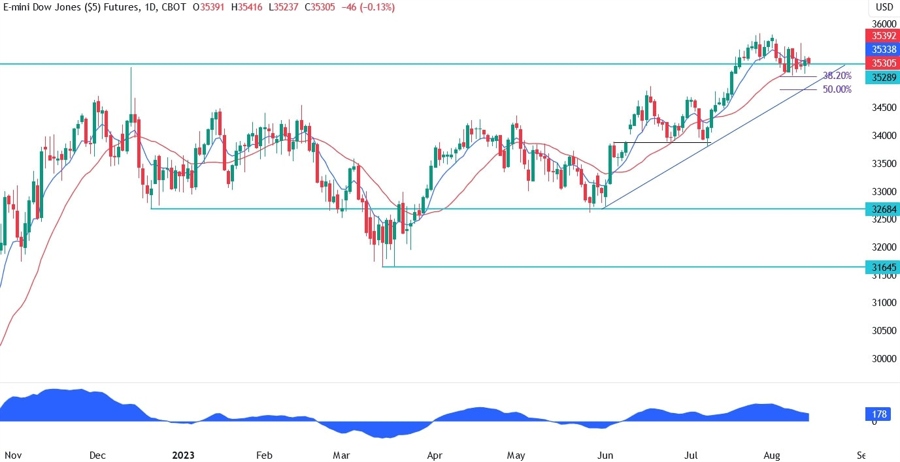
| Resistance 1 | 35289 |
|---|---|
| Quote Price | 35303 |
| Support 1 | 32684 |
| Support 2 | 31645 |
On the daily chart, we can see that the Dow Jones struggled to sustain the rally after breaking out of the key 35289 resistance and started to pull back. The fall below the resistance might be a bad omen for the bulls as a fakeout might lead to a big selloff. For now, the bullish trend remains intact as the price will need to break the trendline to the downside to confirm a fakeout. The price has recently bounced on the 38.2% Fibonacci retracementlevel as the buyers are stepping in to target a new high. The last line of defence for the buyers will be the trendline.
Leave a Reply
You must be logged in to post a comment.