Popular Indices
, 1 hour
 long
long
#Technical
#Consolidation
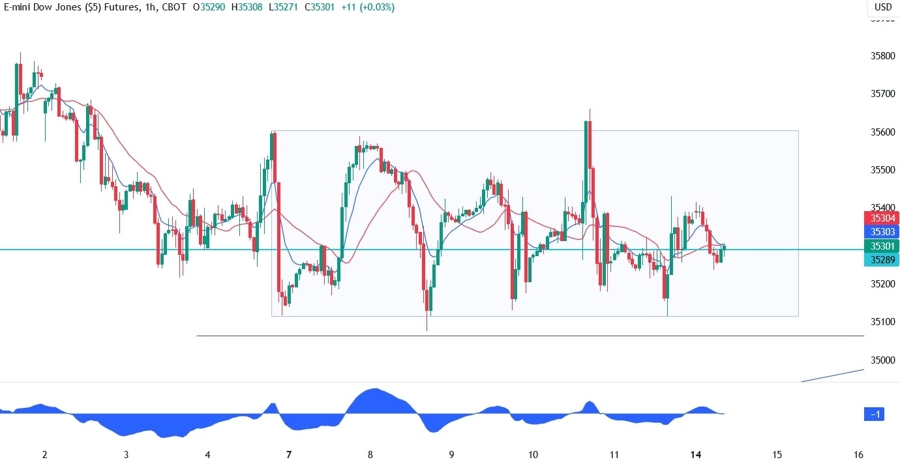
| Resistance 1 | 35600 |
|---|---|
| Support 1 | 35100 |
On the 1 hour chart, we can see more closely the range between the 35100 support and the 35600 resistance. A break to the upside should see the buyers piling in and extend the rally to a new high. On the other hand, a break to the downside should give the sellers more control and lead to a quick fall into the trendline where the sellers will target a breakout.


Leave a Reply
You must be logged in to post a comment.