Indices
, 4 hours
 short
short
#Technical
#Bearish
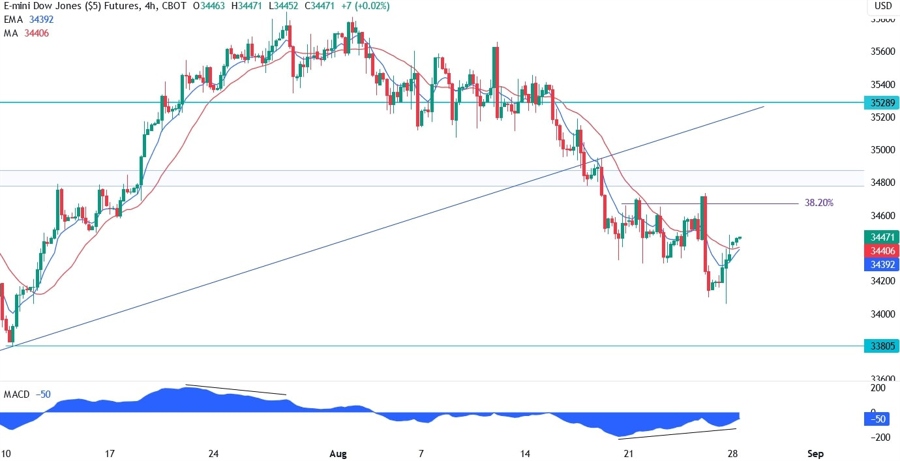
| Resistance 1 | 34700 |
|---|---|
| Quote Price | 34650 |
| Support 1 | 33805 |
On the 4 hour chart, we can see that we have a divergence with the MACD which is generally a sign of weakening momentum often followed by pullbacks or reversals. In this case, we might see a pullback into the 38.2% Fibonacci retracement level where we have also the confluence with the previous highs and the support turned resistance. This is where we can expect the sellers to pile in with a defined risk above the level to target the 33805 support. The buyers, on the other hand, will need the price to break above the resistance to switch the bias from bearish to bullish and start targeting a new high.
Leave a Reply
You must be logged in to post a comment.