Global Indices
, 4 hours
 short
short
#Technical
#Reversal
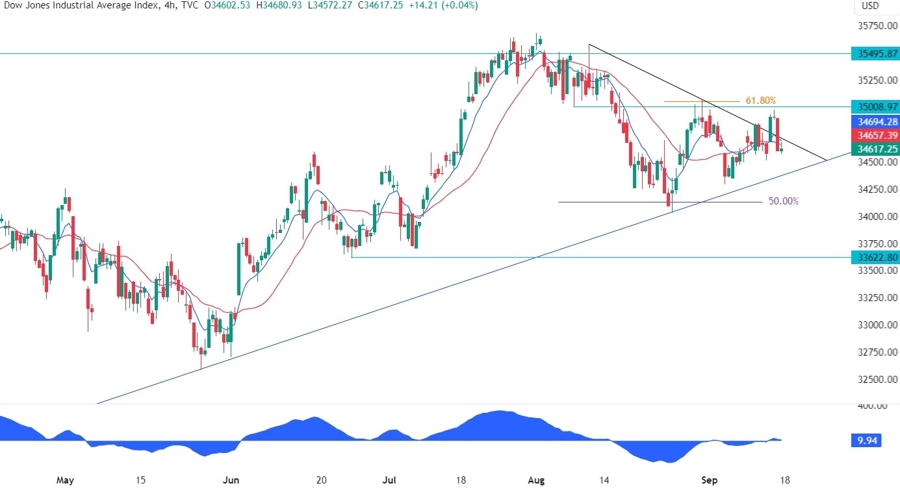
| Resistance 1 | 35008 |
|---|---|
| Quote Price | 34617 |
| Support 1 | 3400 |
| Support 2 | 33622 |
On the 4 hour chart, we can see that we also had the probability that this consolidation was forming a symmetrical triangle but the recent failed breakout should suggest that this wasn’t the case here. Nonetheless, this might even be a signal that the bearish momentum is stronger as we got a fakeout, which is generally a reversal pattern.
Leave a Reply
You must be logged in to post a comment.