XAUUSD
, 1 day
 short
short
#Technical
#Reversal
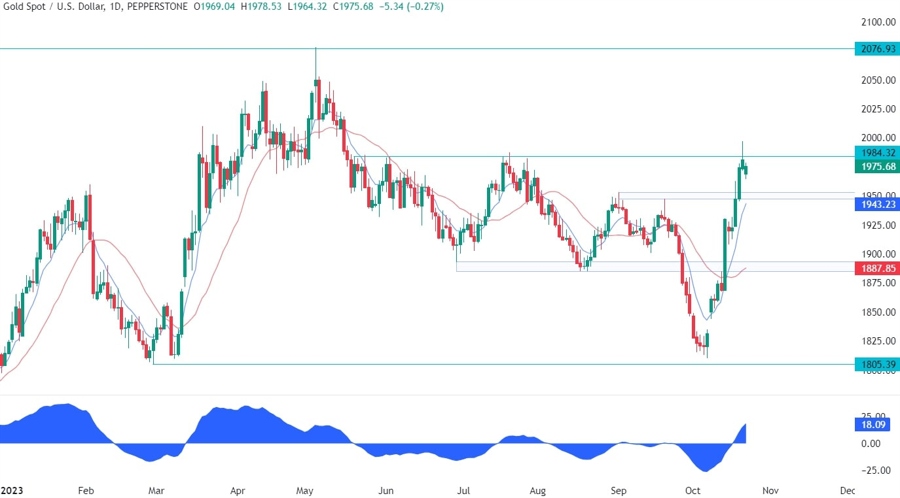
| Resistance 2 | 2076.93 |
|---|---|
| Resistance 1 | 1984.32 |
| Quote Price | 1975.68 |
| Support 1 | 1943.23 |
| Support 2 | 1887.85 |
On the daily chart, we can see that Gold spiked above the key resistance around the 1985 level but eventually got rejected and finished the week below the resistance. This candlestick formation is called “shooting star” and it’s generally a reversal pattern. We can also see that the price got overstretched as depicted by the distance from the blue 8 moving average. In such instances, we can usually see a pullback into the moving average or some consolidation before the next move. We can also notice that the moving average sits right at a support zone, which makes it a very good target for a pullback.
Leave a Reply
You must be logged in to post a comment.