Crude Oil
, 4 hours
 long
long
#Technical
#Bullish
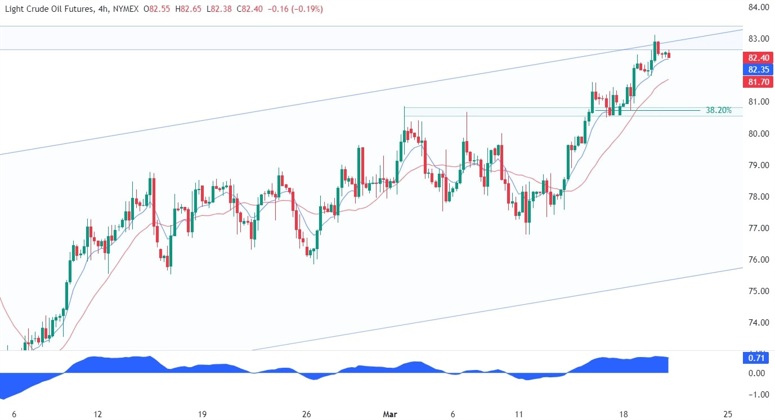
| Resistance 1 | 83.0 |
|---|---|
| Quote Price | 82.40 |
| Support 1 | 81.0 |
On the 4 hour chart, we can see that from a risk management perspective, the buyers will have a much better risk to reward setup around the previous resistance now turned support at the $80 level where we have also the confluence with the 38.2% fibonacci retracement level. The sellers, on the other hand, will want to see the price breaking lower to invalidate the bullish setup and increase the bearish bets into the lower bound of the channel.
Leave a Reply
You must be logged in to post a comment.