LME Copper
, 1 day
 short
short
#Technical
#Bearish
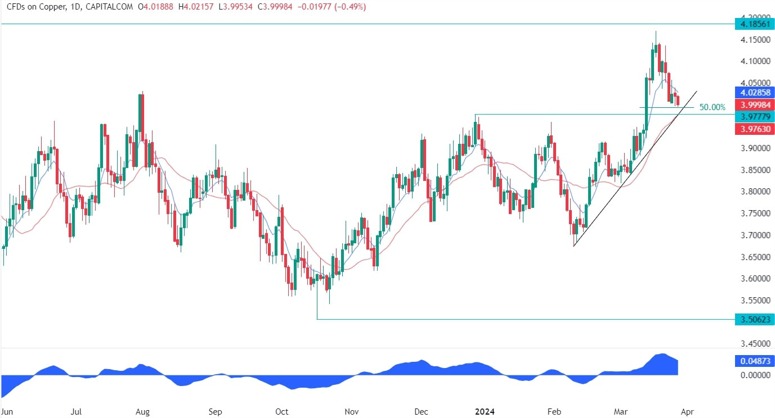
| Resistance 1 | 4.18561 |
|---|---|
| Quote Price | 3.99984 |
| Support 1 | 3.97730 |
On the daily chart, we can see that Copper is now near a key support zone around the 3.98 level where we can find the confluence of the trendline, the 50% Fibonacci retracement level and the red 21 moving average. This is where we can expect the buyers to step in with a defined risk below the trendline to position for a rally into new highs. The sellers, on the other hand, will want to see the price breaking lower to invalidate the bullish setup and increase the bearish bets into the 3.70 level.
Leave a Reply
You must be logged in to post a comment.