LME Copper
, 1 hour
 short
short
#Technical
#Bearish
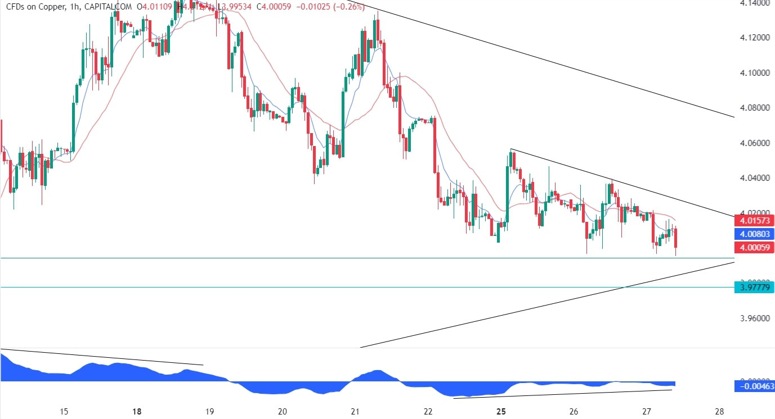
| Resistance 1 | 4.01573 |
|---|---|
| Quote Price | 4.00059 |
| Support 1 | 3.97779 |
On the 1 hour chart, we can see that the price is starting to diverge with the MACD as it approaches the key support zone. This is generally a sign of weakening momentum often followed by pullbacks or reversals. In this case, it could be another bullish signal for the buyers and should give them more confidence to pile in around these levels. If the price were to break lower though, it will be an even stronger signal of a continuation of the downtrend and we can expect the bearish momentum to increase.
Leave a Reply
You must be logged in to post a comment.