Russell MidCap
, 1 hour
 short
short
#Technical
#Bearish
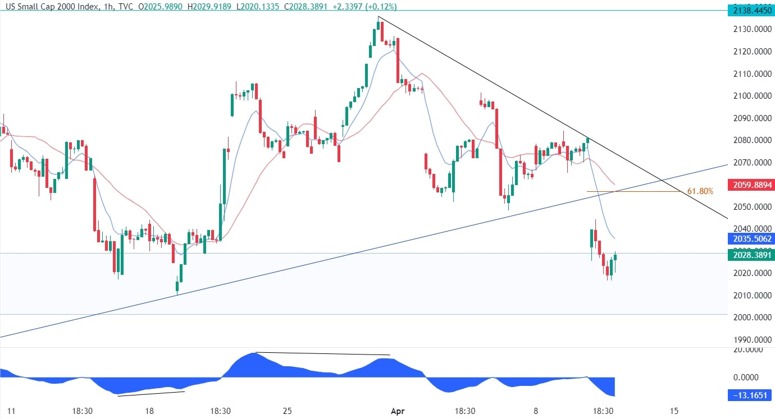
| Resistance 1 | 2059.8894 |
|---|---|
| Quote Price | 2028.3891 |
| Support 1 | 2000.0 |
On the 1 hour chart, we can see that from a risk management perspective, the sellers will have a much better risk to reward setup around the downward trendline where they will also find the confluence of the 61.8% Fibonacci retracement level and the 4-hour 21 moving average. The buyers, on the other hand, will want to see the price breaking higher to invalidate the bearish setup and increase the bullish bets into the cycle highs.
Leave a Reply
You must be logged in to post a comment.