Russell MidCap
, 1 day
 short
short
#Technical
#Bearish
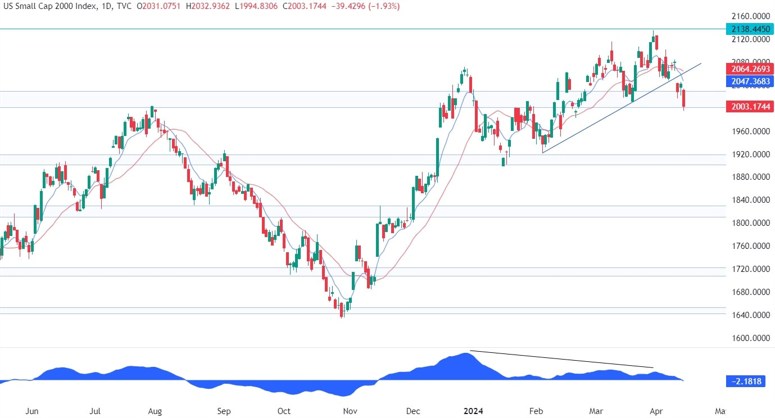
| Resistance 1 | 2138.4450 |
|---|---|
| Quote Price | 2003.1744 |
| Support 1 | 1920.0 |
| Support 2 | 1840.0 |
| Support 3 | 1720.0 |
On the daily chart, we can see that the Russell 2000 fell to the key support zone around the 2020 level following another hot US CPI report and after a small bounce, sold off once more into the weekend following the Iran retaliation news. We can expect the buyers to step in around these levels with a defined risk below the support to position for a rally into new highs. The sellers, on the other hand, will want to see the price breaking lower to increase the bearish bets into the next support at 1920.
Leave a Reply
You must be logged in to post a comment.