NASDAQ Composite
, 1 hour
 short
short
#Technical
#Bearish
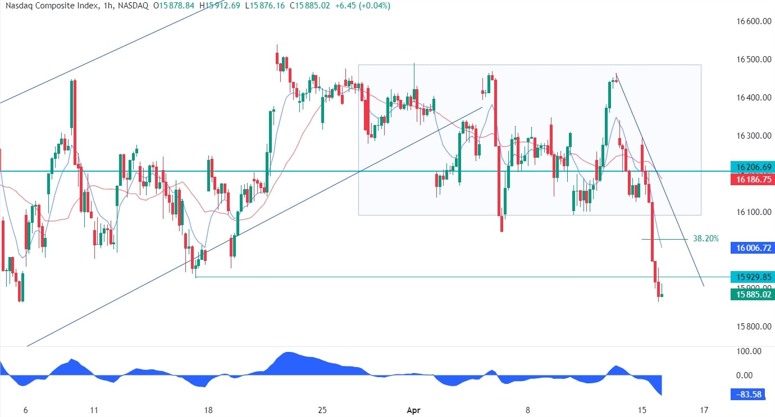
| Resistance 1 | 16100.0 |
|---|---|
| Quote Price | 15885.02 |
| Support 1 | 15800.0 |
On the 1 hour chart, we can see that we now have a trendline defining the current downward momentum where we can find the confluence of the 38.2% Fibonacci retracement level and the blue 8 moving average. This is where we can expect the sellers to step in with a defined risk above the trendline to position for new lows. The buyers, on the other hand, will want to see the price breaking higher to increase the bullish bets into a new all-time high.
Leave a Reply
You must be logged in to post a comment.