Russell MidCap
, 1 hour
 short
short
#Technical
#Reversal
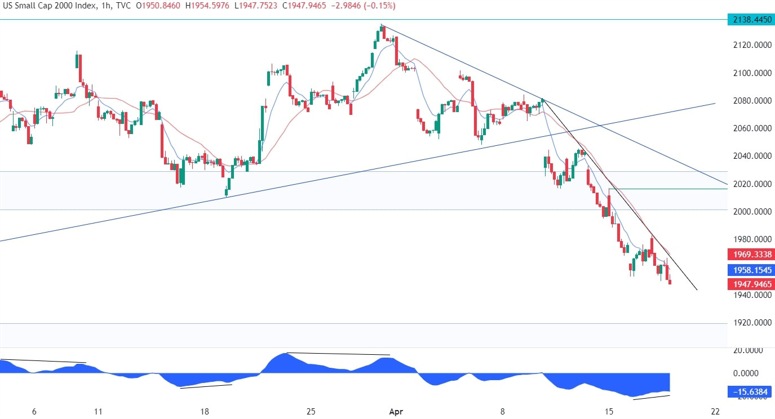
| Resistance 1 | 2020.0 |
|---|---|
| Quote Price | 1947.9645 |
| Support 1 | 1920.0 |
On the 1 hour chart, we can see that we have a minor black trendline which has been defining the current downward momentum with the red 21 moving average acting as dynamic resistance. We can also notice that the price is starting to diberge with the MACD which is generally a sign of weakening momentum often followed by pullbacks or reversals. In this case, the sellers will likely lean on the trendline again to position for the final push into the 1920 support. The buyers, on the other hand, will want to see the price breaking higher to start targeting the major trendline around the 2020 resistance.
Leave a Reply
You must be logged in to post a comment.