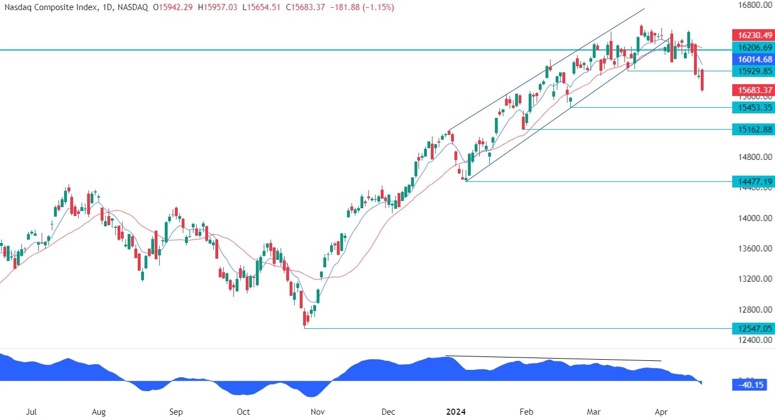
NASDAQ Composite
, 1 day
 short
short
#Technical
#Reversal
| Resistance 1 | 16230.49 |
|---|---|
| Quote Price | 15683.37 |
| Support 1 | 15453.35 |
| Support 2 | 15162.88 |
On the 1 hour chart, we can see that the price has been diverging with the MACD, which is generally a sign of weakening momentum often followed by pullbacks or reversals. In this case, the ultimate target for the pullback should be the base of the divergent formation around the 1.26 handle with a break above it confirming a reversal. In case, we get a rejection from the 1.25 resistance, the buyers might lean on the black counter-trendline to position for a rally into the major trendline. The sellers, on the other hand, will want to see the price breaking lower to increase the bearish bets into new lows.


Leave a Reply
You must be logged in to post a comment.