NASDAQ Composite
, 1 day
 short
short
#Technical
#Consolidation
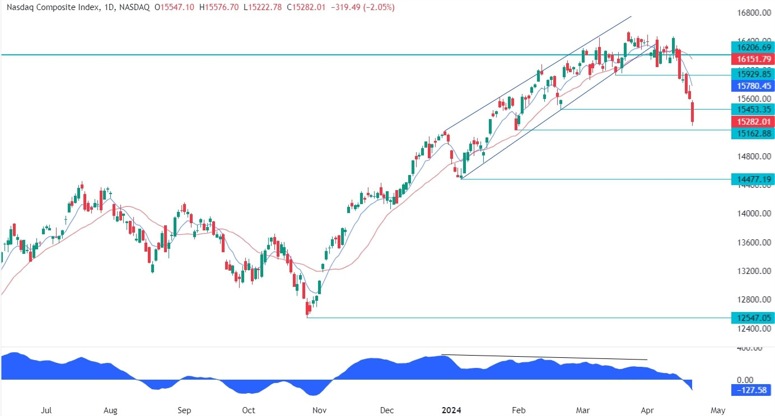
| Resistance 1 | 15929.85 |
|---|---|
| Quote Price | 15282.01 |
| Support 1 | 15162.88 |
| Support 2 | 14477.19 |
On the daily chart, we can see that the Nasdaq Composite broke through another key level at 15453 and extended the selloff into the 15162 support. We can also notice that the price got a bit overstretched as depicted by the distance from the blue 8 moving average. In such instances, we can generally see a pullback into the moving average or some consolidation before the next move. The buyers might start to pile in more aggressively around these levels to position for a rally into a new all-time high with a better risk to reward setup. The sellers, on the other hand, will want to see the price breaking lower to increase the bearish bets into next support at 14477.
Leave a Reply
You must be logged in to post a comment.