US500-S&P 500 (GSPC, INX, SPX)
, 1 day
 short
short
#Technical
#Bearish
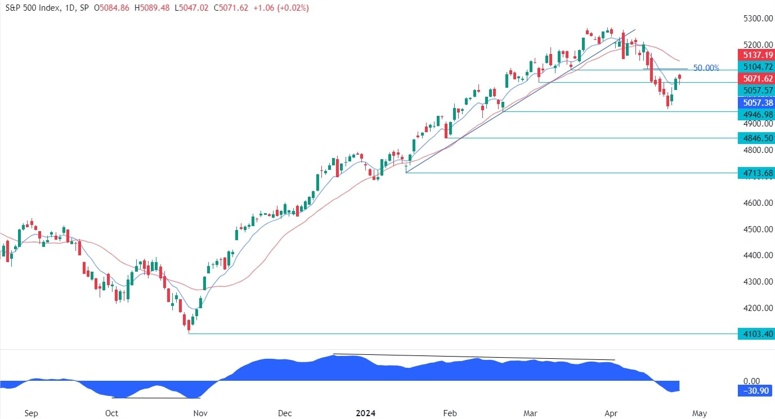
| Resistance 1 | 5137.19 |
|---|---|
| Quote Price | 5071.62 |
| Support 1 | 5057.38 |
| Support 2 | 4846.50 |
| Support 3 | 4713.68 |
On the daily chart, we can see that the S&P 500 is trading near a key resistance level at 5104 where we can also find the confluence of the 50% fibonacci retracement level and the red 21 moving average This is where we can expect the sellers to step in with a defined risk above the resistance to position for a drop into new lows. The buyers, on the other hand, will want to see the price breaking higher to invalidate the bearish setup and position for a rally into a new all-time high.
Leave a Reply
You must be logged in to post a comment.