Global Indices
, 1 day
 short
short
#Technical
#Bearish
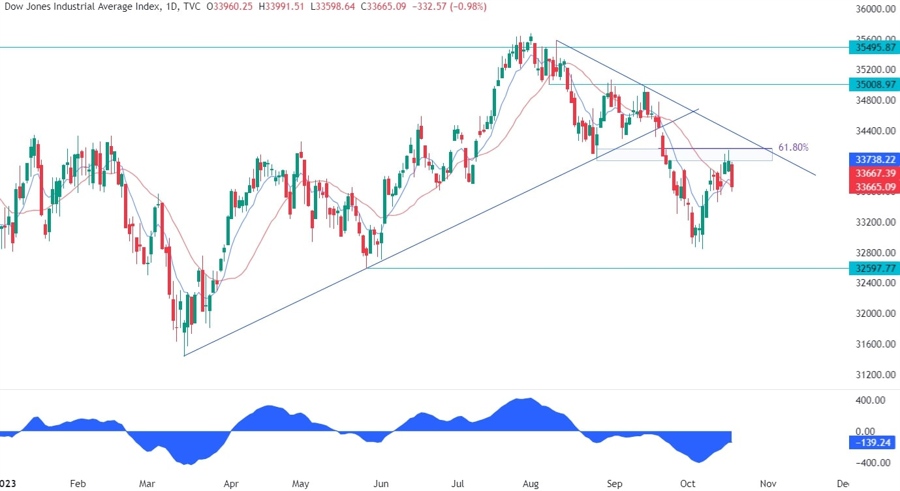
| Resistance 1 | 34000 |
|---|---|
| Quote Price | 33665 |
| Support 1 | 32597 |
On the daily chart, we can see that the Dow Jones eventually reached the key resistance zone around the 34000 level where we had the confluence with the previous swing low level and the 61.8% Fibonacci retracement level. The sellers piled in with a defined risk above the resistance to position for a drop back into the lows. The buyers, on the other hand, will need the price to break above the trendline to invalidate the bearish setup and start targeting the cycle highs.
Leave a Reply
You must be logged in to post a comment.