XAUUSD
, 4 hours
 long
long
#Technical
#Bullish
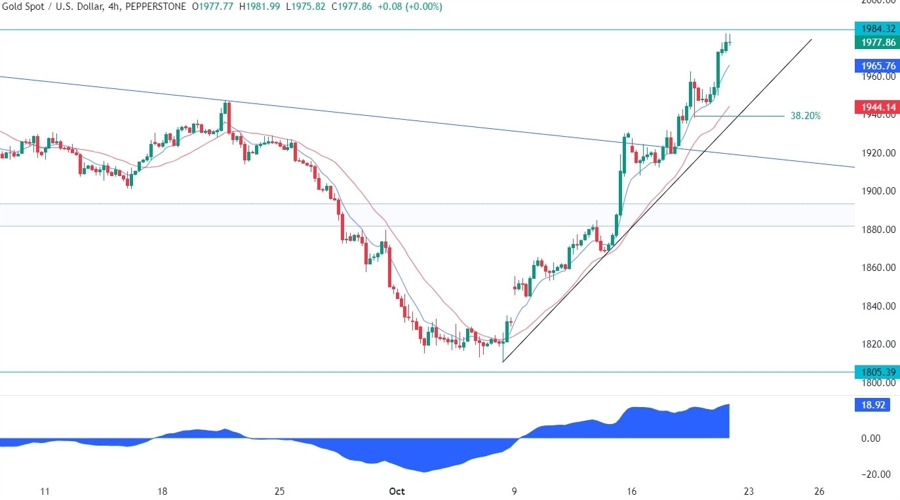
| Resistance 1 | 1984 |
|---|---|
| Quote Price | 1940 |
| Support 1 | 1880 |
On the 4 hour chart, we can see that we have a good support zone around the trendline where we can also find the 38.2% Fibonacci retracement level and the red 21 moving average for confluence . This is where we can expect the buyers to step in with a defined risk below the trendline to target a break above the resistance and the all-time highs next. The sellers, on the other hand, will want to see the price breaking lower to increase the bearish bets into the lows.
Leave a Reply
You must be logged in to post a comment.