XAUUSD
, 1 hour
 short
short
#Technical
#Reversal
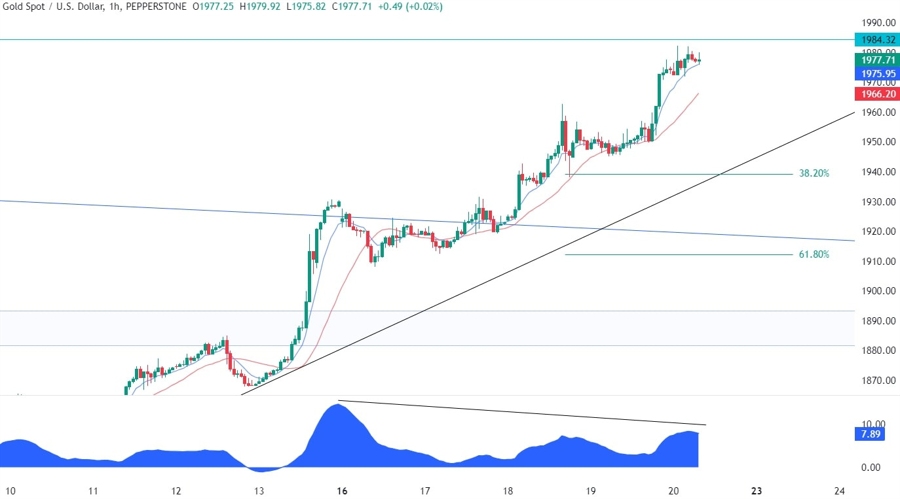
| Resistance 1 | 1984 |
|---|---|
| Quote Price | 1940 |
| Support 1 | 1910 |
On the 1 hour chart, we can see that we have a divergence with the MACD right at the key resistance. This is generally a sign of weakening momentum often followed by pullbacks or reversals. In this case, from a risk management perspective, the buyers would be better off to wait for a pullback into the trendline before opening new longs. The last line of defence for the buyers should be around the broken downward trendline and the 61.8% Fibonacci retracement level.
Leave a Reply
You must be logged in to post a comment.