Hang Seng Index
Parent Index
NA
Indices informations
Listed Exchanges
| Hong Kong Stock Exchange |
Related Instuments
| HSI Volatility |
| HSI Short |
Sector Represented
| Finance |
| Utilities |
| Properties |
| Commerce & Industry |
Indices
- BSE SENSEX
- CAC 40
- CBOE NASDAQ-100 Volatility Index (VXN)
- CBOE Volatility Index (VIX)
- China50-FTSE China A50 Index
- DAX
- DAX PERFORMANCE-INDEX-GDAXI
- DE40-Germany 40 Index DAX
- Dollar Index USDX-DXY-DX-Dixie
- Dow Jones Industrial Average-DJIA
- EURO STOXX 50 SX5E
- FTSE 100 Index-UK100 Index
- Germany 30
- Hang Seng Index
- IBEX 35-Spain 35
- NASDAQ Composite
- NASDAQ-100
- Nikkei 225
- Russell 2000 Index
- S&P/ASX 200
- Singapore Blue Chip Index-STI
- Swiss Market Index (SMI) Switzerland Blue Chip Index
- TecDax Price Index
- TECHDE30-Germany Tech 30 Index
- US Tech 100 Index UT100
- US2000-US Small Cap 2000 Index
- US30-US Wall Street 30 Index
- US30M- US Wall Street 30 Index M
- US500-S&P 500 (GSPC, INX, SPX)
- US500-US SPX 500 Index
- US500M-S&P 500 Mini
- All Ordinaries
- Amsterdam Exchange Index AEX index
- ATX-Austrian Traded Index (ATX)
- BEL 20
- BELEX15
- BIRS
- BIST-Borsa Istanbul
- CROBEX
- EGX 30 Index Egypts Leading Stock Market Index
- FTSE All-Share Index
- FTSE Bursa Malaysia Index-KLCI Index
- FTSE MIB-FTSE MIB 40
- Índice Bursátil Caracas (IBC)
- Índice Bursátil de Capitalización-The General Index
- Indice de Precios y Cotizaciones
- KOSPI
- KSE 100 Index
- MDAX
- MERVAL
- MICEX-The MOEX Russia Index
- OBX Index
- OMX Copenhagen 20 (OMXC20)
- OMX Helsinki 25 (OMXH25)
- OMX Stockholm 30 (OMXS30)
- PSE Index (PSEi)
- PSI20-PSI-20
- S&P/NZX 50 Index
- S&P/TSX 60
- S&P/TSX Composite Index
- S&P/TSX Venture Composite Index
- SOFIX
- SSE Composite Index (上证综指) Shanghai Composite Index
- Straits Times Index (STI)
- SZSE Component Index (深证成指)
- TA-125 Tel Aviv 125 Index
- Taiwan Capitalization Weighted Stock Index (TAIEX)
- The Indice de Precio Selectivo de Acciones- IPC
- CBOE NASDAQ-100 BuyWrite Index (BXN)
- Hang Seng China H-Financials Index
- IBOVESPA-The Bovespa Index-Brazil Stock Exchange Index
- NASDAQ Financial-100
- SDAX – Small cap
- TecDAX
- aaa
- Amex Gold BUGS Index
- Amex Oil Index
- AScX index – Small cap
- ASE Weighted Index
- Athex 20
- Barrons 400 Index
- BELEXline
- BET-10
- BSE DCI
- BSE FCI
- BUMIX – Mid cap
- BUX – Large cap
- CA60-Canada 60 Index
- CAC All Share
- CAC All-Tradable
- CAC Large 60
- CAC Mid & Small
- CAC Mid 60
- CAC Next 20
- CAC Small
- Capital Markets Index
- CASPI
- CBOE DJIA BuyWrite Index (BXD)
- CBOE S&P 500 BuyWrite Index (BXM)
- CBV Index
- CBV Real Estate Index
- CECEEUR
- Central European Blue Chip Index – Regional large cap
- ChinaH-Hong Kong China H-shares Index
- COLCAP
- Colombo Stock Exchange Sector indices (CSE Sectors)
- CROBIS
- CSC X
- CSE 30
- CSE50
- CSI
- CSI 100 Index (中证100指数)
- CSI 300 Index (沪深300指数)
- Dow Jones Global Titans 50
- Dow Jones Transportation Average
- Dow Jones Utility Average
- DSE
- DSEX
- DSM200
- EGX 100 Index
- EGX 50 Index
- EGX 70 Index
- ERS10
- FIRS
- FT 30 Index
- FTSE 350 Index
- FTSE AIM All-Share Index
- FTSE AIM UK 50 Index
- FTSE All-World index series
- FTSE Fledgling Index
- FTSE Italia Mid Cap
- FTSE MID 250 Index
- FTSE SmallCap Index
- FTSE techMark Index
- FTSE/Athex Large Cap
- FTSE/JSE All Share Index
- FTSE/JSE Top 40 Index
- FTSEurofirst 300 Index
- FTSEurofirst Euro Supersector Indices
- GSE All-Share Index
- Hang Seng China Enterprises Index
- Hang Seng China-Affiliated Corporations Index
- HK50
- IDX Composite
- IGBC
- IPSA
- ISEQ 20-The Ireland Overall Stock Exchange Index-ISEQ20
- IT40-Italy 40 Index
- Jakarta Islamic Index (JII)
- Jamaica Stock Exchange (JSE)
- KASE
- KMI 30 Index
- KOSDAQ
- KSE All Share Index
- KSE-30 Index
- Kuala Lumpur Composite Index
- LASI
- LQ-45
- LuxX Index – Luxembourg Stock Exchange
- MADEX index
- Madrid Stock Exchange General Index
- MASI index
- MESDAQ
- MIDDE50-Germany Mid 50 Index
- MIDDE60-Germany Mid 60 Index
- Milanka Price Index (MPI)
- MSCI EAFE
- MSCI GCC
- MSCI Hong Kong Index
- MSCI World
- MSM-30
- NEPSE Index – Nepal Stock Exchange
- NETH25
- NIFTY 100 LOW VOLATILITY 30
- NIFTY 200
- NIFTY ALPHA 50
- NIFTY BANK
- NIFTY CPSE
- NIFTY ENERGY
- NIFTY FINANCE
- NIFTY FMCG
- NIFTY INDIA CONSUMPTION
- NIFTY INFRA
- NIFTY IT
- NIFTY MEDIA
- NIFTY METAL
- NIFTY MIDCAP 100
- NIFTY MIDCAP 50
- NIFTY MIDCAP LIQUID 15
- NIFTY MIDSMALLCAP 400
- NIFTY MNC
- NIFTY Next 50
- NIFTY PHARMA
- NIFTY PSE
- NIFTY PSU BANK
- NIFTY PVT BANK
- NIFTY REALTY
- NIFTY SERV SECTOR
- NIFTY SMALLCAP 100
- NIFTY SMALLCAP 250
- NIFTY SMALLCAP 50
- NIFTY100 EQUAL WEIGHT
- NIFTY100 LIQUID 15
- NIFTY200 QUALITY 30
- NIFTY50 EQUAL WEIGHT
- Nor25-Norway 25 Index
- NSE 30 Index
- NSE All Share Index
- NSE NIFTY 50
- NYSC Arca Major Market Index
- NYSE American Composite Index
- OMX Iceland 15 (discontinued)
- OMX Iceland 6
- OMX Stockholm PI (OMXSPI)
- OMX Vilnius (OMXV)
- OTCM QX ADR 30 Index
- Palisades Water Index (ZWI)
- PFTS index
- Philadelphia Gold and Silver Index
- PHLX Semiconductor Sector
- PSE All Shares Index
- PSE Financials Index
- PSE Mining and Oil Index
- PSI/GERAL
- PX Index
- RTS Index (RTSI)
- Russell 1000
- Russell 2500
- Russell 3000
- Russell MidCap
- Russell Small Cap Completeness
- S&P 100
- S&P 1500
- S&P Asia 50
- S&P BSE 500
- S&P Europe 350
- S&P Global 100
- S&P Global 1200
- S&P Latin America 40
- S&P MidCap 400
- S&P MidCap 400/BARRA Growth
- S&P MidCap 400/BARRA Value
- S&P SmallCap 600
- S&P SmallCap 600/BARRA Growth
- S&P SmallCap 600/BARRA Value
- S&P Vietnam 10 Index
- S&P/ASX 20
- S&P/ASX 300
- S&P/ASX 50
- SA40-South Africa 40 Index
- SBF 120
- SE30-Sweden 30 Index
- SET Index
- SET100 Index
- SET50 Index
- Slovak Share Index
- SMI Expanded
- SMI MID
- SPBLPGPT
- SSE 180 Index (上证180指数)
- SSE 50 Index (上证50指数)
- STOXX Europe 600
- SWI20-Switzerland 20 Index
- Swiss Leader Index (SLI)
- Swiss Performance Index (SPI)
- SZSE 100 Index (深证100指数)
- SZSE 200 Index (深证200指数)
- SZSE 300 Index (深证300指数)
- TA-35 Index
- TA-90
- Tadawul
- TEDPIX
- TEPIX
- The Global Dow
- The GSE Composite Index.
- THETAUSD Theta Network Token vs US Dollar
- TOPIX
- Trinidad and Tobago Stock Exchange (TTSE)
- UBS 100 Index
- Value Line Composite Index
- VN Index
- WIG-Warszawski Indeks Giełdowy
- WIG30
- Wilshire 4500
- Wilshire 5000
- Zimbabwe Industrial Index
- Zimbabwe Mining Index
The Hang Seng Index (HSI) is a benchmark stock market index that represents the performance of the Hong Kong stock market. It was first introduced on November 24, 1969, and has since become one of the most widely recognized indicators of the Hong Kong financial market’s overall health and performance.
The HSI tracks the performance of the top 50 companies listed on the Hong Kong Stock Exchange based on market capitalization. These companies represent various sectors including finance, telecommunications, utilities, property development, and more. As such, the HSI provides investors with key insights into the overall performance of the Hong Kong economy and its constituent industries.
Here are some key data points to consider when analyzing the Hang Seng Index:
1. Index Value:
The Hang Seng Index is a weighted index, meaning that the components’ weightings are based on their market capitalization. The index value represents the aggregate value of the constituent stocks and serves as a reference point for tracking the overall performance of the index over time.
2. Constituent Stocks:
The HSI includes the top 50 blue-chip companies listed on the Hong Kong Stock Exchange. Some well-known constituents include HSBC Holdings, Tencent Holdings, AIA Group, China Mobile, and many more. Understanding the composition of these companies can provide insights into the sectors driving the market and the overall sentiment of investors towards them.
3. Price/Earnings Ratio (P/E Ratio):
The P/E ratio indicates the valuation of a company’s stock relative to its earnings. It is calculated by dividing the market price per share by the earnings per share. A high P/E ratio suggests that investors have high expectations for future earnings growth, while a low P/E ratio may indicate undervaluation. Monitoring the average P/E ratio of the HSI can provide insights into market sentiment and expectations.
4. Trading Volume:
Trading volume refers to the total number of shares traded for a particular stock or index within a given period. It helps gauge investor interest and liquidity in the market. Higher trading volume generally indicates increased market activity and can be an indicator of market sentiment or potential price movements.
5. Dividend Yield:
The dividend yield is the annual dividend paid by a company divided by its current stock price. It provides investors with an idea of the return they can expect from holding a specific stock. Monitoring the average dividend yield of the HSI can help investors assess the income potential of the index’s constituent stocks.
Understanding these key data points can provide valuable insights when analyzing the Hang Seng Index. Investors can use this information to make informed decisions regarding their investment strategies and gain a better understanding of the overall performance of the Hong Kong stock market.
Fundamental Summary
- Coming soon!!
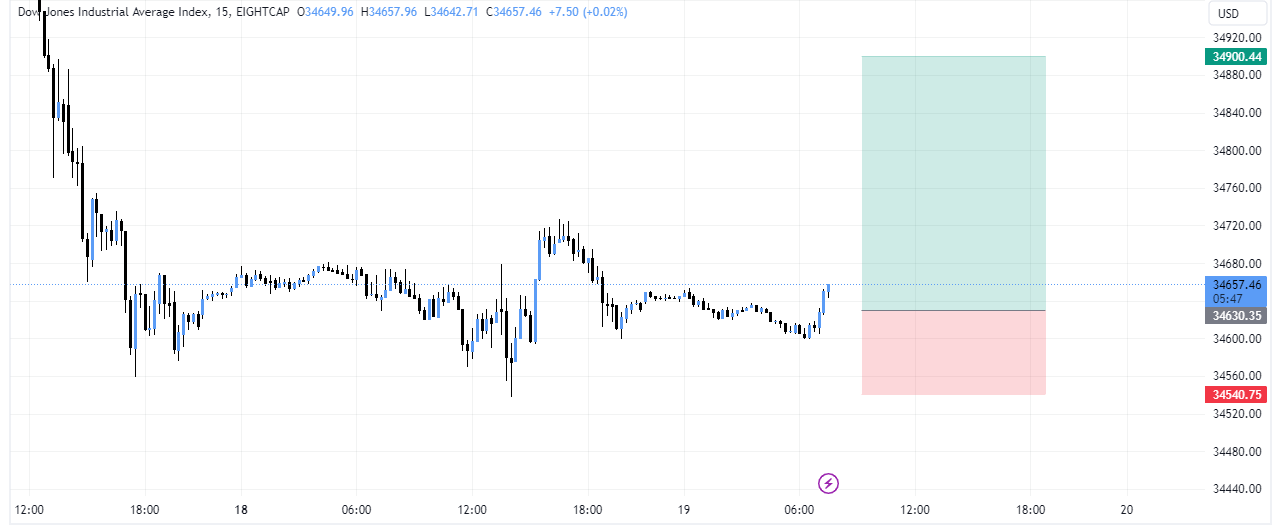
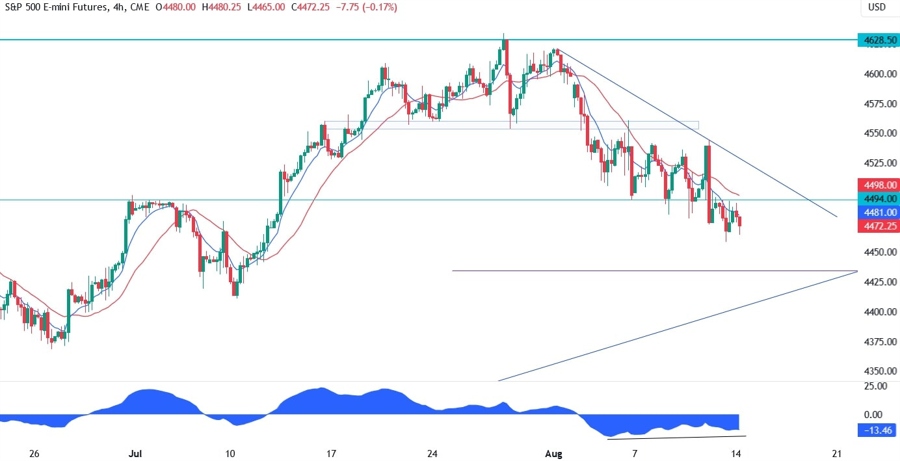
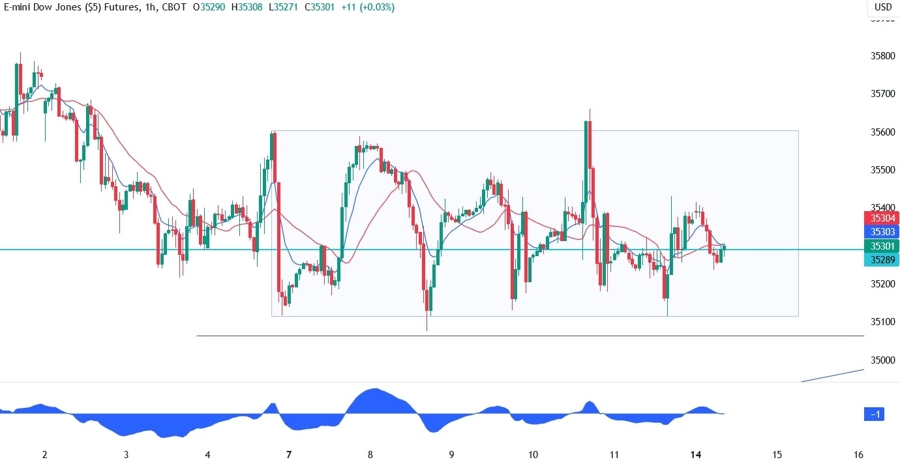
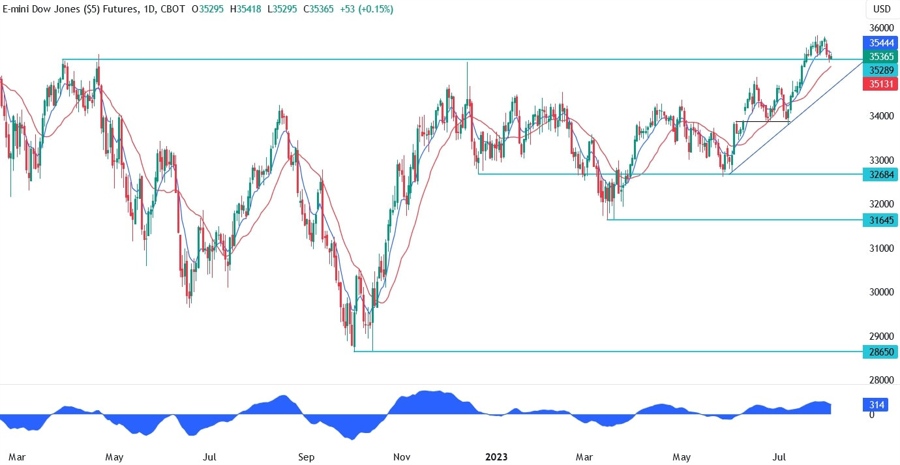
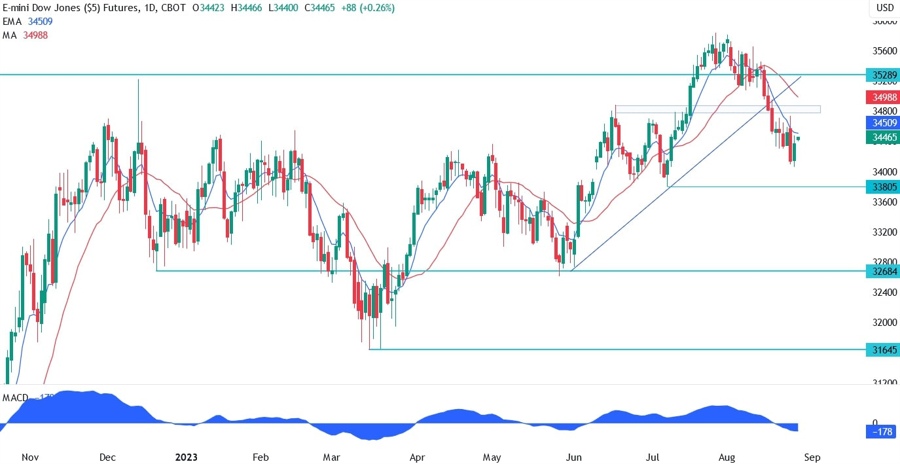
Technical Summary
Related Content
course
post
post
post
post
post

course
course
post
post
post