PSE Index (PSEi)
Parent Index
NA
Indices informations
Listed Exchanges
| Philippine Stock Exchange |
Related Instuments
| N/A |
Sector Represented
| Holding Firms |
| Financials |
| Services |
| Property |
| Industrial |
Indices
- BSE SENSEX
- CAC 40
- CBOE NASDAQ-100 Volatility Index (VXN)
- CBOE Volatility Index (VIX)
- China50-FTSE China A50 Index
- DAX
- DAX PERFORMANCE-INDEX-GDAXI
- DE40-Germany 40 Index DAX
- Dollar Index USDX-DXY-DX-Dixie
- Dow Jones Industrial Average-DJIA
- EURO STOXX 50 SX5E
- FTSE 100 Index-UK100 Index
- Germany 30
- Hang Seng Index
- IBEX 35-Spain 35
- NASDAQ Composite
- NASDAQ-100
- Nikkei 225
- Russell 2000 Index
- S&P/ASX 200
- Singapore Blue Chip Index-STI
- Swiss Market Index (SMI) Switzerland Blue Chip Index
- TecDax Price Index
- TECHDE30-Germany Tech 30 Index
- US Tech 100 Index UT100
- US2000-US Small Cap 2000 Index
- US30-US Wall Street 30 Index
- US30M- US Wall Street 30 Index M
- US500-S&P 500 (GSPC, INX, SPX)
- US500-US SPX 500 Index
- US500M-S&P 500 Mini
- All Ordinaries
- Amsterdam Exchange Index AEX index
- ATX-Austrian Traded Index (ATX)
- BEL 20
- BELEX15
- BIRS
- BIST-Borsa Istanbul
- CROBEX
- EGX 30 Index Egypts Leading Stock Market Index
- FTSE All-Share Index
- FTSE Bursa Malaysia Index-KLCI Index
- FTSE MIB-FTSE MIB 40
- Índice Bursátil Caracas (IBC)
- Índice Bursátil de Capitalización-The General Index
- Indice de Precios y Cotizaciones
- KOSPI
- KSE 100 Index
- MDAX
- MERVAL
- MICEX-The MOEX Russia Index
- OBX Index
- OMX Copenhagen 20 (OMXC20)
- OMX Helsinki 25 (OMXH25)
- OMX Stockholm 30 (OMXS30)
- PSE Index (PSEi)
- PSI20-PSI-20
- S&P/NZX 50 Index
- S&P/TSX 60
- S&P/TSX Composite Index
- S&P/TSX Venture Composite Index
- SOFIX
- SSE Composite Index (上证综指) Shanghai Composite Index
- Straits Times Index (STI)
- SZSE Component Index (深证成指)
- TA-125 Tel Aviv 125 Index
- Taiwan Capitalization Weighted Stock Index (TAIEX)
- The Indice de Precio Selectivo de Acciones- IPC
- CBOE NASDAQ-100 BuyWrite Index (BXN)
- Hang Seng China H-Financials Index
- IBOVESPA-The Bovespa Index-Brazil Stock Exchange Index
- NASDAQ Financial-100
- SDAX – Small cap
- TecDAX
- aaa
- Amex Gold BUGS Index
- Amex Oil Index
- AScX index – Small cap
- ASE Weighted Index
- Athex 20
- Barrons 400 Index
- BELEXline
- BET-10
- BSE DCI
- BSE FCI
- BUMIX – Mid cap
- BUX – Large cap
- CA60-Canada 60 Index
- CAC All Share
- CAC All-Tradable
- CAC Large 60
- CAC Mid & Small
- CAC Mid 60
- CAC Next 20
- CAC Small
- Capital Markets Index
- CASPI
- CBOE DJIA BuyWrite Index (BXD)
- CBOE S&P 500 BuyWrite Index (BXM)
- CBV Index
- CBV Real Estate Index
- CECEEUR
- Central European Blue Chip Index – Regional large cap
- ChinaH-Hong Kong China H-shares Index
- COLCAP
- Colombo Stock Exchange Sector indices (CSE Sectors)
- CROBIS
- CSC X
- CSE 30
- CSE50
- CSI
- CSI 100 Index (中证100指数)
- CSI 300 Index (沪深300指数)
- Dow Jones Global Titans 50
- Dow Jones Transportation Average
- Dow Jones Utility Average
- DSE
- DSEX
- DSM200
- EGX 100 Index
- EGX 50 Index
- EGX 70 Index
- ERS10
- FIRS
- FT 30 Index
- FTSE 350 Index
- FTSE AIM All-Share Index
- FTSE AIM UK 50 Index
- FTSE All-World index series
- FTSE Fledgling Index
- FTSE Italia Mid Cap
- FTSE MID 250 Index
- FTSE SmallCap Index
- FTSE techMark Index
- FTSE/Athex Large Cap
- FTSE/JSE All Share Index
- FTSE/JSE Top 40 Index
- FTSEurofirst 300 Index
- FTSEurofirst Euro Supersector Indices
- GSE All-Share Index
- Hang Seng China Enterprises Index
- Hang Seng China-Affiliated Corporations Index
- HK50
- IDX Composite
- IGBC
- IPSA
- ISEQ 20-The Ireland Overall Stock Exchange Index-ISEQ20
- IT40-Italy 40 Index
- Jakarta Islamic Index (JII)
- Jamaica Stock Exchange (JSE)
- KASE
- KMI 30 Index
- KOSDAQ
- KSE All Share Index
- KSE-30 Index
- Kuala Lumpur Composite Index
- LASI
- LQ-45
- LuxX Index – Luxembourg Stock Exchange
- MADEX index
- Madrid Stock Exchange General Index
- MASI index
- MESDAQ
- MIDDE50-Germany Mid 50 Index
- MIDDE60-Germany Mid 60 Index
- Milanka Price Index (MPI)
- MSCI EAFE
- MSCI GCC
- MSCI Hong Kong Index
- MSCI World
- MSM-30
- NEPSE Index – Nepal Stock Exchange
- NETH25
- NIFTY 100 LOW VOLATILITY 30
- NIFTY 200
- NIFTY ALPHA 50
- NIFTY BANK
- NIFTY CPSE
- NIFTY ENERGY
- NIFTY FINANCE
- NIFTY FMCG
- NIFTY INDIA CONSUMPTION
- NIFTY INFRA
- NIFTY IT
- NIFTY MEDIA
- NIFTY METAL
- NIFTY MIDCAP 100
- NIFTY MIDCAP 50
- NIFTY MIDCAP LIQUID 15
- NIFTY MIDSMALLCAP 400
- NIFTY MNC
- NIFTY Next 50
- NIFTY PHARMA
- NIFTY PSE
- NIFTY PSU BANK
- NIFTY PVT BANK
- NIFTY REALTY
- NIFTY SERV SECTOR
- NIFTY SMALLCAP 100
- NIFTY SMALLCAP 250
- NIFTY SMALLCAP 50
- NIFTY100 EQUAL WEIGHT
- NIFTY100 LIQUID 15
- NIFTY200 QUALITY 30
- NIFTY50 EQUAL WEIGHT
- Nor25-Norway 25 Index
- NSE 30 Index
- NSE All Share Index
- NSE NIFTY 50
- NYSC Arca Major Market Index
- NYSE American Composite Index
- OMX Iceland 15 (discontinued)
- OMX Iceland 6
- OMX Stockholm PI (OMXSPI)
- OMX Vilnius (OMXV)
- OTCM QX ADR 30 Index
- Palisades Water Index (ZWI)
- PFTS index
- Philadelphia Gold and Silver Index
- PHLX Semiconductor Sector
- PSE All Shares Index
- PSE Financials Index
- PSE Mining and Oil Index
- PSI/GERAL
- PX Index
- RTS Index (RTSI)
- Russell 1000
- Russell 2500
- Russell 3000
- Russell MidCap
- Russell Small Cap Completeness
- S&P 100
- S&P 1500
- S&P Asia 50
- S&P BSE 500
- S&P Europe 350
- S&P Global 100
- S&P Global 1200
- S&P Latin America 40
- S&P MidCap 400
- S&P MidCap 400/BARRA Growth
- S&P MidCap 400/BARRA Value
- S&P SmallCap 600
- S&P SmallCap 600/BARRA Growth
- S&P SmallCap 600/BARRA Value
- S&P Vietnam 10 Index
- S&P/ASX 20
- S&P/ASX 300
- S&P/ASX 50
- SA40-South Africa 40 Index
- SBF 120
- SE30-Sweden 30 Index
- SET Index
- SET100 Index
- SET50 Index
- Slovak Share Index
- SMI Expanded
- SMI MID
- SPBLPGPT
- SSE 180 Index (上证180指数)
- SSE 50 Index (上证50指数)
- STOXX Europe 600
- SWI20-Switzerland 20 Index
- Swiss Leader Index (SLI)
- Swiss Performance Index (SPI)
- SZSE 100 Index (深证100指数)
- SZSE 200 Index (深证200指数)
- SZSE 300 Index (深证300指数)
- TA-35 Index
- TA-90
- Tadawul
- TEDPIX
- TEPIX
- The Global Dow
- The GSE Composite Index.
- THETAUSD Theta Network Token vs US Dollar
- TOPIX
- Trinidad and Tobago Stock Exchange (TTSE)
- UBS 100 Index
- Value Line Composite Index
- VN Index
- WIG-Warszawski Indeks Giełdowy
- WIG30
- Wilshire 4500
- Wilshire 5000
- Zimbabwe Industrial Index
- Zimbabwe Mining Index
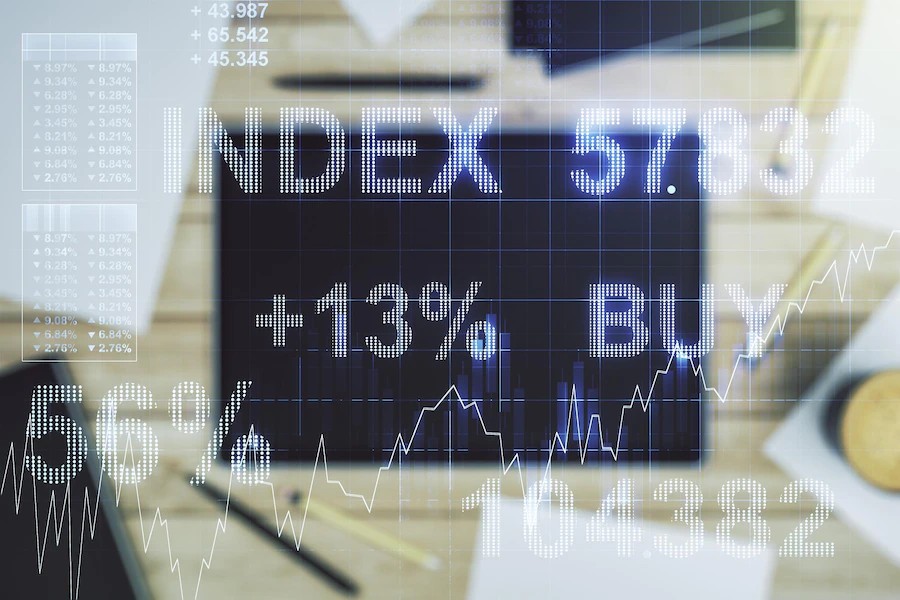
PSE Composite Index (PSEi): An Overview of the Philippine Stock Exchange
The PSE Composite Index, commonly known as the PSEi, is the main stock market index in the Philippines. It represents the performance of the top 30 publicly listed companies traded on the Philippine Stock Exchange (PSE). The PSEi is widely regarded as a barometer of the Philippine equity market and serves as an indicator of the overall health and direction of the economy.
Established in 1987, the PSEi is composed of companies from various sectors, including financials, property development, telecommunications, utilities, and more. These 30 constituent stocks are carefully selected based on liquidity, market capitalization, and other factors that ensure representativeness and diversity. As a result, the PSEi reflects the performance of the broad market and showcases the trends and movements in the Philippine stock market.
Investors and market participants closely monitor the PSEi as it provides valuable insights into the investment climate and sentiment in the Philippines. Changes in the index’s value can reflect market trends, investor confidence, and economic performance. Additionally, the PSEi serves as a benchmark for mutual funds, exchange-traded funds (ETFs), and other investment vehicles that track the Philippine equities market.
Calculating the PSE Composite Index is based on a free-float adjusted market capitalization-weighted methodology. This means that the larger the market capitalization of a constituent stock, the greater its impact on the overall index value. Regular reviews are conducted to ensure that the index composition remains relevant and representative of the market.
The PSEi is also used as a reference point for various financial products, such as index futures, options, and other derivatives traded on the PSE. It allows investors to hedge their portfolios or speculate on the future direction of the index, providing opportunities for risk management and potential profits.
Investing in the PSEi can be done through individual stock purchases or through index funds and ETFs that track the performance of the index. The PSEi’s performance over the years has shown its resilience to economic downturns and its potential for long-term growth. However, as with any investment, it is important to conduct thorough research, diversify your portfolio, and consider your risk tolerance before investing in the stock market.
In conclusion, the PSE Composite Index (PSEi) is a significant barometer of the Philippine stock market and provides valuable insights into the overall health and direction of the country’s economy. Investors, both local and international, rely on the PSEi to make informed decisions and gauge market sentiment. As the Philippines continues to grow and develop, the PSEi will remain a critical indicator of the nation’s financial landscape.
PSE Composite Index Key Data: Understanding the Pulse of the Philippine Stock Market
The PSE Composite Index (PSEi) is the main stock market index in the Philippines. It represents the performance of the country’s largest and most actively traded companies listed on the Philippine Stock Exchange (PSE). The PSEi serves as a barometer for the overall health and direction of the Philippine stock market.
Composition:
The PSE Composite Index is composed of 30 blue-chip stocks, carefully selected to represent various sectors of the economy. These companies are chosen based on their market capitalization, liquidity, and free-float level. Some of the notable companies included in the PSEi are Ayala Corporation, SM Investments Corporation, Jollibee Foods Corporation, and San Miguel Corporation.
Calculation:
The PSE Composite Index is a weighted index, meaning that the individual components are assigned different weights based on their market capitalization. This ensures that larger companies have a greater impact on the index’s movement. The index is calculated using a base value of 10,000 points, which was set on January 4, 1988.
Market Capitalization:
Market capitalization refers to the total value of a company’s outstanding shares. It is a key factor in determining a company’s weight in the PSE Composite Index. Companies with higher market capitalization exert a greater influence on the index’s movements. Investors often track changes in market capitalization to assess the overall growth and performance of the market.
Trading Volume and Liquidity:
The trading volume of a stock refers to the number of shares bought or sold during a given period. Liquidity, on the other hand, measures how easily a stock can be bought or sold without significantly impacting its price. Higher trading volumes and liquidity indicate investor interest and confidence in the market. The PSE Composite Index incorporates these factors to provide a comprehensive view of the market.
Market Trends and Investor Sentiment:
The PSE Composite Index is closely watched by investors, analysts, and market participants to gauge market trends and investor sentiment. A rising index indicates bullishness and optimism in the market, while a declining index suggests bearishness and caution. Investors utilize the index to make informed decisions on buying or selling stocks.
Implications for the Economy:
The performance of the PSE Composite Index reflects the overall health of the Philippine economy. A strong index implies that businesses are doing well, leading to higher employment rates and improved economic conditions. On the contrary, a weak index may signal economic challenges that need to be addressed. Policymakers and economists closely monitor the movements of the index to make informed decisions about economic policies and interventions.
Conclusion:
The PSE Composite Index is an essential tool for investors and stakeholders interested in the Philippine stock market. It provides a snapshot of the market’s performance and serves as a benchmark for evaluating investment opportunities. As investors navigate the dynamic world of stocks and investments, understanding key data like the PSE Composite Index becomes crucial for making informed decisions and maximizing potential returns.
Fundamental Summary
- Coming soon!!
Technical Summary
Related Content
post
post
post
post

course
course
post
post
post
post