Popular Indices
, 1 day
 long
long
#Technical
#Reversal
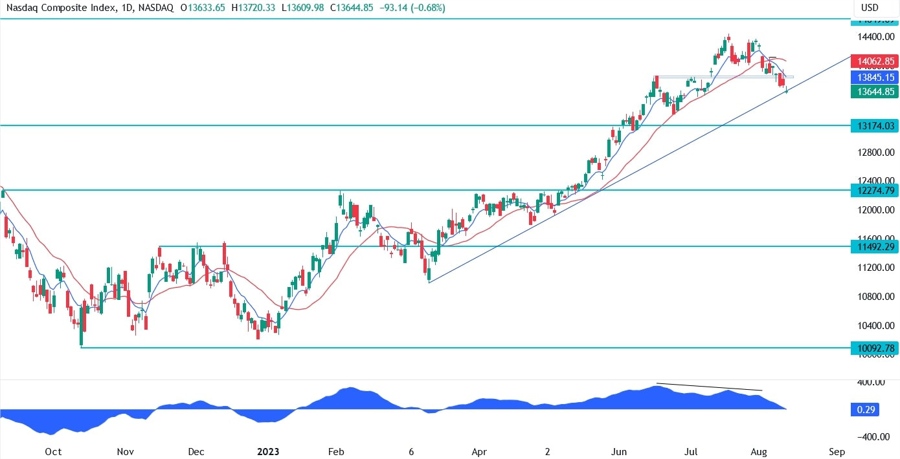
| Resistance 1 | 14400 |
|---|---|
| Quote Price | 13845 |
| Support 1 | 13174 |
| Support 2 | 12274 |
On the daily chart, we can see that the Nasdaq Composite was diverging with the MACD while approaching the key 14649 resistance and this is generally a sign of weakening momentum often followed by pullbacks or reversals. In this case, we are still in the pullback scenario as the price is now at a key trendline where we should expect the buyers stepping in and target the 14649 resistance. If the price breaks lower, we might be in front of a reversal and the sellers are likely to pile in aggressively to extend the selloff into the 13174 support.
Leave a Reply
You must be logged in to post a comment.