NASDAQ Composite
, 1 day
 short
short
#Technical
#Bearish
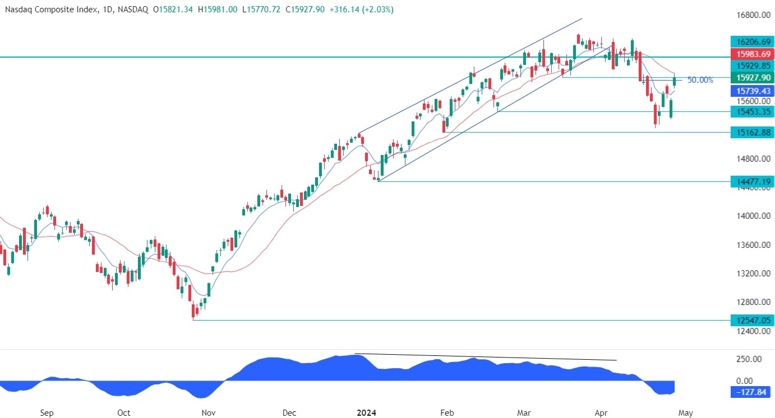
| Resistance 1 | 15983.69 |
|---|---|
| Quote Price | 15927.90 |
| Support 1 | 15453.35 |
| Support 2 | 15162.88 |
| Support 3 | 14477.19 |
On the daily chart, we can see that the Nasdaq Composite reached a key resistance zone around the 15929 level where we can also find the confluence of the 50% fibonacci retracement level and the red 21 moving average. This is where the sellers will likely step in with a defined risk above the moving average to position for a drop into new lows. The buyers, on the other hand, will want to see the price breaking higher to invalidate the bearish setup and increase the bullish bets into a new all-time high.
Leave a Reply
You must be logged in to post a comment.