US500-S&P 500 (GSPC, INX, SPX)
, 4 hours
 short
short
#Technical
#Bearish
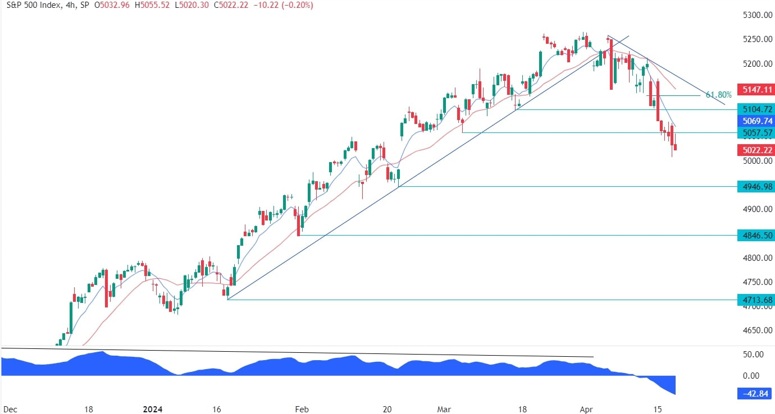
| Resistance 1 | 5147.11 |
|---|---|
| Quote Price | 5022.22 |
| Support 1 | 4947.98 |
| Support 2 | 4846.50 |
On the 4 hour chart, we can see that from a risk management perspective, the sellers will have a much better risk to reward setup around the trendline where they will also find the confluence of the red 21 moving average and the 61.8% Fibonacci retracement level. The buyers, on the other hand, will want to see the price breaking higher to invalidate the bearish setup and position for a rally into a new all-time high
Leave a Reply
You must be logged in to post a comment.