US500-S&P 500 (GSPC, INX, SPX)
, 4 hours
 short
short
#Technical
#Bearish
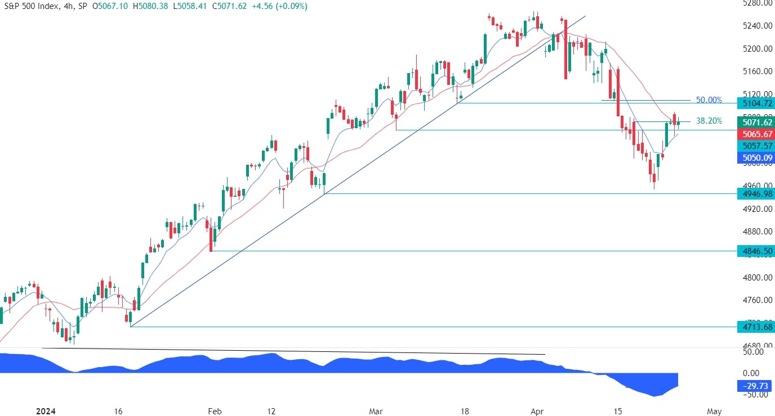
| Resistance 1 | 5104.72 |
|---|---|
| Quote Price | 5071.62 |
| Support 1 | 4946.98 |
| Support 2 | 4846.50 |
On the 4 hour chart, we can see that the relief rally found some resistance around the 38.2% Fibonacci retracement level where we have also the red 21 moving average for confluence. These two levels will be the entry points for the sellers as a break above them should trigger an even stronger rally and invalidate the bearish setup. There’s not much else we can glean from this chart, so we need to zoom in to see some more details.
Leave a Reply
You must be logged in to post a comment.