Crude Oil
, 1 hour
 long
long
#Technical
#Reversal
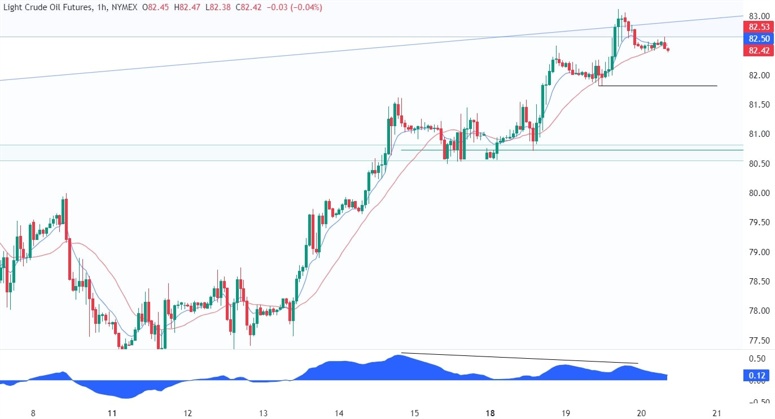
| Resistance 1 | 83.0 |
|---|---|
| Quote Price | 82.42 |
| Support 1 | 81.0 |
On the 1 hour chart, we can see that the latest rally into the $83 resistance diverged with the MACD, which is generally a sign of weakening momentum often followed by pullbacks or reversals. In this case, it might be a signal for a pullback into the $80 support since the target is usually the base of the divergent formation. A break below the most recent swing low at $81.80 should confirm the bigger correction into the $80 level and see the sellers increasing the bearish bets into the lows.
Leave a Reply
You must be logged in to post a comment.