Global Indices
, 4 hours
 long
long
#Technical
#Consolidation
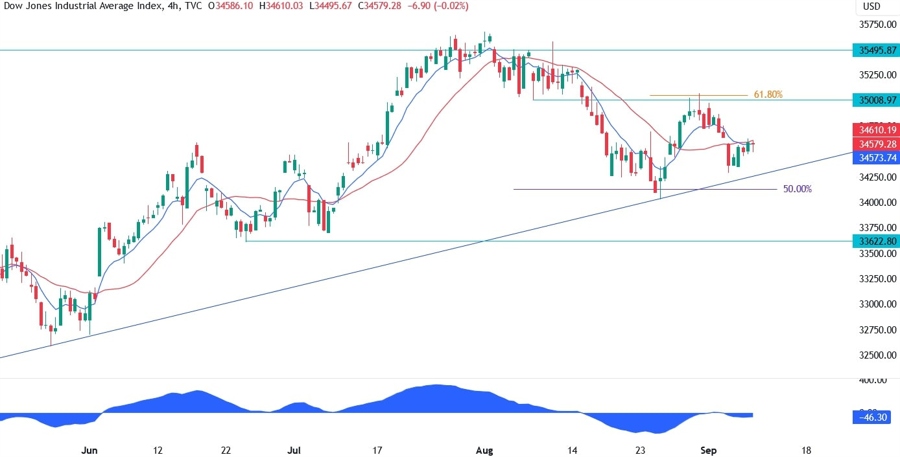
| Resistance 1 | 35008 |
|---|---|
| Quote Price | 34579 |
| Support 1 | 34000 |
On the 4 hour chart, we can see that at the moment we have some consolidation near the trendline as the economic data sends mixed signals. The selloff from the resistance led to a moving averages crossover and we might see the sellers leaning on the red 21 moving average here to position for a break below the trendline.
Leave a Reply
You must be logged in to post a comment.