Russell MidCap
, 1 day
 long
long
#Technical
#Reversal
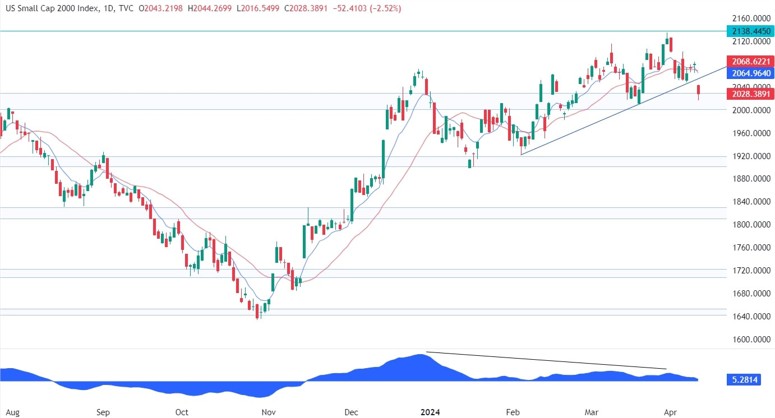
| Resistance 1 | 2138.4450 |
|---|---|
| Quote Price | 2028.3891 |
| Support 1 | 1920.0 |
| Support 2 | 1840.0 |
On the daily chart, we can see that the Russell 2000 has been diverging with the MACD which is generally a sign of weakening momentum often followed by pullbacks or reversals. We broke below the key trendline yesterday which should be a confirmation for a reversal and a move towards the base of the divergent formation around the 1920 support Before that though, the sellers will need to see the price breaking below the key 2020 support zone to increase the bearish bets into the 1920 support. The buyers, on the other hand, will likely step in here with a defined risk below the support to position for a rally back into the highs.
Leave a Reply
You must be logged in to post a comment.