Russell MidCap
, 1 hour
 long
long
#Technical
#Reversal
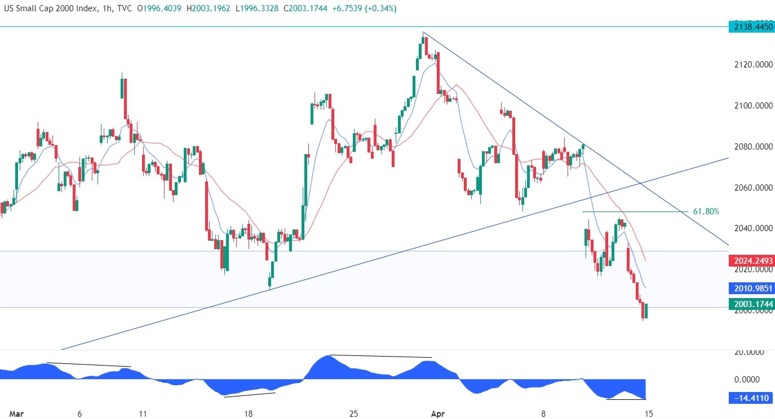
| Resistance 1 | 2050.0 |
|---|---|
| Quote Price | 2003.1744 |
| Support 1 | 2000.0 |
On the 1 hour chart, we can see that besides the trendline and the moving average, the sellers will also find the 61.8% fibonacci retracement level adding some extra confluence to the resistance around the 2045 level. We can also notice that the latest leg lower diverged with the MACD which is generally a sign of weakening momentum often followed by pullbacks or reversals. In this case, it could be a signal for a pullback into the downward trendline and give the buyers some more conviction for the initial upward move.
Leave a Reply
You must be logged in to post a comment.