Russell MidCap
, 1 day
 short
short
#Technical
#Bearish
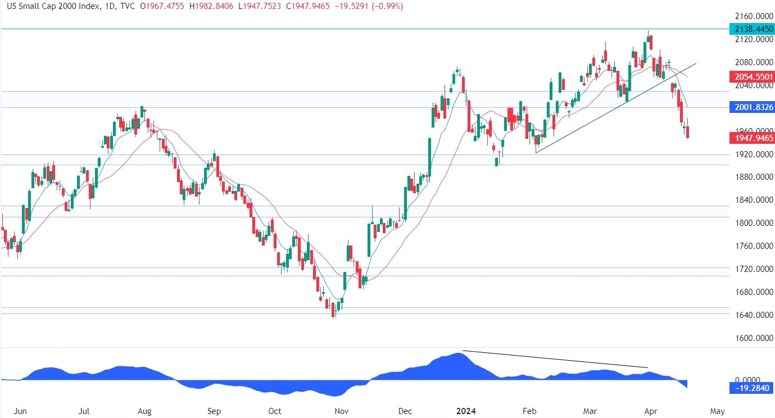
| Resistance 1 | 2138.4450 |
|---|---|
| Quote Price | 1940.9645 |
| Support 1 | 1920.0 |
| Support 2 | 1840.0 |
On the daily chart, we can see that the Russell 2000 broke through the key support zone around the 2020 level and extended the selloff into the 1950 level. The 1920 support looks inevitable at this point. The buyers will likely step in there with a defined risk below the support to position for a rally back into the 2020 resistance. The sellers, on the other hand, will want to see the price breaking lower to increase the bearish bets into the next support at 1820.
Leave a Reply
You must be logged in to post a comment.